TL;DR: WordPress performance optimization starts at the server, not in a plugin settings page. Fix your hosting and PHP version first (biggest single lever), audit your wp_options autoloaded data (often a hidden bottleneck), implement layered caching (page, object, browser, CDN), then tackle frontend issues like render-blocking CSS and unoptimized images. Measure everything with Query Monitor before and after changes. Skip the generic speed tips and work through the stack methodically.
Table of contents
Most WordPress performance guides are written for people who don’t write code. They tell you to install a caching plugin, enable lazy loading, and call it a day. That’s fine if you’re a site owner who just wants faster pages. But if you’re a developer, you need to understand why things are slow at the code level, not just which toggle to flip.
This guide is the developer’s debugging playbook for WordPress performance optimization. We’re going to work through the entire stack, from server configuration to database queries to frontend delivery. Every recommendation here comes with the technical reasoning behind it, so you can make informed decisions instead of blindly following a checklist.
The order matters. We start at the server because your hosting environment sets the performance floor. No amount of frontend optimization will save you if your TTFB is 800ms. Then we work outward through the database, caching layers, and frontend, where each optimization compounds on the previous one.
Measure before you optimize
The single biggest mistake developers make with WordPress performance is optimizing blind. You install WP Rocket, enable every toggle, and hope for the best. Three hours later your site is faster, but you have no idea which change actually mattered.
Query Monitor is your primary tool. It’s a free plugin that adds a panel to the admin bar showing page generation time, peak memory usage, SQL query count, and total query duration. The Queries tab is where you’ll spend most of your time. It lists every database query with its execution time and lets you filter by component (core, theme, plugin), so you can isolate exactly which piece of code is dragging things down.
The profiling API is worth learning:
do_action( 'qm/start', 'my_function' );
my_potentially_slow_function();
do_action( 'qm/stop', 'my_function' );
This wraps any function in a timing measurement that shows up in Query Monitor’s output. Use it to profile specific functions you suspect are slow, rather than guessing.
For the full picture, pair Query Monitor with Google PageSpeed Insights (lab and field data for Core Web Vitals), GTmetrix (waterfall charts that show exactly where time is spent), and Chrome DevTools Performance tab (JavaScript profiling and rendering analysis).
Run at least three tests per page and use the median result. Always clear all caches between tests, including your WordPress cache, CDN cache, and browser cache. And test from a location close to where your actual users are, not from your local machine connected to the same data center as your server.
The baseline metrics you’re tracking:
| Metric | Good | Needs work | Poor |
|---|---|---|---|
| LCP (Largest Contentful Paint) | <2.5s | 2.5-4.0s | >4.0s |
| INP (Interaction to Next Paint) | <200ms | 200-500ms | >500ms |
| CLS (Cumulative Layout Shift) | <0.1 | 0.1-0.25 | >0.25 |
| TTFB (Time to First Byte) | <200ms | 200-500ms | >500ms |
Write these numbers down before you change anything. You’ll need them to verify that your optimizations actually worked.
Hosting: the performance foundation
Your server’s Time to First Byte is the performance floor. LCP cannot be faster than your TTFB, full stop. If your shared hosting takes 800ms just to start generating a response, you’re already behind before any HTML reaches the browser.
Quality managed hosting delivers TTFB under 200ms. Cheap shared hosting often sits at 500ms or more. That 300-600ms difference propagates through every metric downstream. If your current host is the bottleneck, our WordPress migration guide covers how to switch hosts without any downtime.
The three hosting decisions that matter most for WordPress performance:
PHP version. PHP 8.2 and above offers roughly 30% better performance than 7.4. If your host still runs PHP 7.x, that’s your first upgrade. Most modern plugins support 8.2+, and the performance gain is free.
Web server. Nginx or LiteSpeed both outperform Apache for WordPress workloads. If you’re on Apache and can switch, do it. If you’re on managed hosting, this is already handled for you.
Object cache. Redis or Memcached stores database query results in memory so WordPress doesn’t have to hit MySQL on every request. One documented case showed a WooCommerce cart page dropping from 32 database queries to 2 after enabling Redis, cutting page generation time from 85ms to 53ms. On larger sites the impact is more dramatic. A WooCommerce store with 14,000 products cut load time from 11.3 seconds to 2.9 seconds after implementing Redis alongside other optimizations.
Managed WordPress hosts like Kinsta, Cloudways, and Rocket.net handle all of this out of the box: latest PHP, Nginx, Redis, server-level caching, and Cloudflare Enterprise. If your current hosting can’t give you a sub-200ms TTFB, the most impactful performance optimization you can make is switching hosts. No plugin will compensate for a slow server.
One more thing: if your site gets any meaningful traffic, blocking malicious bot traffic can reduce your server load significantly. Rate limiting and edge firewalls have been shown to decrease server load by 30% and improve TTFB by about 200ms.
Database optimization
The wp_options table is where WordPress stores site settings, plugin configurations, and transient data. Every row with autoload = 'yes' gets loaded into memory on every single page request. This is often a hidden performance killer that no caching plugin will fix.
Start by checking how much autoloaded data you’re carrying:
SELECT SUM(LENGTH(option_value)) / 1024 / 1024 AS autoload_mb
FROM wp_options WHERE autoload='yes';
Under 800KB is healthy. Over 1MB needs attention. Over 3MB is actively hurting your performance. One real-world optimization reduced autoloaded data from 2.8MB to 700KB and improved TTFB by 28%.
Find the biggest offenders:
SELECT option_name, LENGTH(option_value) / 1024 AS size_kb
FROM wp_options WHERE autoload='yes'
ORDER BY LENGTH(option_value) DESC LIMIT 20;
Common culprits include orphaned plugin data (plugins you uninstalled but their options remain), expired transients that never got cleaned up, 301 redirect plugins storing routes in the database instead of at the server level, and bloated session data from misconfigured cron jobs.
Post revisions are the other major source of database bloat. WordPress stores unlimited revisions by default, and on a site with hundreds of posts, that’s thousands of extra rows in wp_posts. Limit revisions to 5 in your wp-config.php:
define('WP_POST_REVISIONS', 5);For existing bloat, WP-Optimize is the most reliable cleanup tool. It handles revisions, auto-drafts, spam comments, expired transients, and orphaned metadata. Run it once to clean up, then schedule weekly maintenance.
After cleanup, run OPTIMIZE TABLE wp_posts; OPTIMIZE TABLE wp_options; OPTIMIZE TABLE wp_postmeta; to reclaim disk space and defragment the tables.
Caching architecture for developers
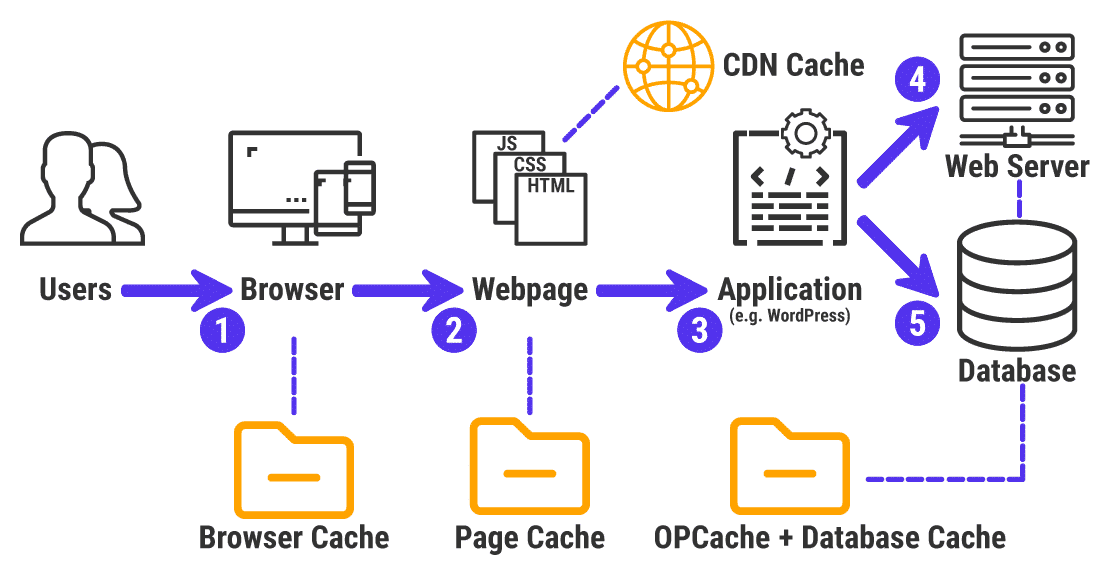
WordPress caching works in layers. Each layer intercepts requests before they hit the next (slower) layer. Understanding the full stack matters more than picking the right plugin.
Browser cache stores static assets (CSS, JS, images, fonts) on the user’s device. Subsequent visits skip downloading those files entirely. One benchmark showed repeat visits dropping data transfer from 1.2MB to 118KB, cutting load time from 893ms to 573ms. Set long cache-control headers (1 year) for versioned assets, and WordPress handles cache busting through query strings like ?ver=6.4.2.
CDN cache distributes your static files across edge servers worldwide, reducing latency for users far from your origin server. Cloudflare’s free tier covers static assets. Their APO add-on ($5/month) also caches full HTML pages at the edge, which can cut TTFB by up to 50% for global audiences. BunnyCDN and KeyCDN are solid alternatives.
Page cache is the biggest single win. It converts your dynamic WordPress pages (PHP execution, database queries, template rendering) into static HTML files. The WordPress developer handbook states that page caching can improve performance “several hundred times over for fairly static pages.” One benchmark on a 4vCPU DigitalOcean server showed a 10x increase in requests per second and 5x faster average response time. Enable cache preloading to eliminate cold cache hits, and set expiration to 24 hours for most sites.
Object cache (Redis or Memcached) stores database query results in memory. This matters most on dynamic pages that can’t be fully page-cached, like WooCommerce carts, user dashboards, or any page with personalized content. Enable it in wp-config.php with define('WP_CACHE', true);.
One anti-pattern to avoid: never run two caching plugins simultaneously. They’ll conflict with each other and create cache incoherency, where users see stale or partially cached content. Pick one caching solution and use it consistently. WP Rocket ($59/year) handles most of this automatically. LiteSpeed Cache (free) is the better choice if your host runs LiteSpeed web server.
Frontend performance engineering
After server-side optimizations, the frontend is where you fine-tune delivery. Images, CSS, JavaScript, and fonts all compete for bandwidth and main thread time.
Images make up 47-70% of total page weight on most WordPress sites. Three changes make the biggest difference: convert to WebP or AVIF format (25-50% smaller files), compress at 80-85% quality (visually identical, 40-70% size reduction), and lazy load everything below the fold. But do not lazy load your hero image. Your LCP element needs fetchpriority="high" and ideally a preload hint:
<link rel="preload" as="image" href="hero.webp" fetchpriority="high">Critical CSS is the minimum stylesheet needed to render above-the-fold content. Inline it in the <head>, then defer the rest. One implementation took a PageSpeed score from 43 to 94, dropped LCP from 10.2 seconds to 0.7 seconds, and eliminated Total Blocking Time entirely. WP Rocket generates critical CSS automatically. If you’re doing it manually, tools like critical (npm package) extract the above-the-fold styles for you.
JavaScript blocks the main thread. Add defer to scripts that don’t need to run immediately, and delay non-essential scripts (analytics, chat widgets, social embeds) until user interaction. In WordPress, use the script_loader_tag filter:
add_filter('script_loader_tag', function($tag, $handle, $src) {
    if ($handle === 'my-script') {
        return str_replace(' src', ' defer src', $tag);
    }
    return $tag;
}, 10, 3);
Also disable WordPress features you don’t use. The emoji detection script loads on every page and almost nobody needs it:
remove_action('wp_head', 'print_emoji_detection_script', 7);
remove_action('wp_print_styles', 'print_emoji_styles');
Fonts can cause both render delays and layout shifts. Self-host your web fonts instead of loading from Google Fonts CDN, use font-display: swap for visual stability, and preload your primary font file:
<link rel="preload" href="/fonts/inter.woff2" as="font"
      type="font/woff2" crossorigin>
For plugin-heavy sites, Asset CleanUp or Perfmatters ($24.95/year) lets you disable specific plugin scripts and styles on pages where they aren’t needed. A contact form plugin loading its JavaScript on every page when you only have one contact page is a common example of wasted resources.
wp-config.php performance constants
WordPress has built-in performance levers that most developers never touch. These go in your wp-config.php before the “That’s all, stop editing!” line.
// Memory allocation
define('WP_MEMORY_LIMIT', '256M');
define('WP_MAX_MEMORY_LIMIT', '512M');

// Post revisions (limit database bloat)
define('WP_POST_REVISIONS', 5);
define('AUTOSAVE_INTERVAL', 300);

// Cron (replace with system cron for predictable execution)
define('DISABLE_WP_CRON', true);

// Script handling
define('COMPRESS_SCRIPTS', true);
define('COMPRESS_CSS', true);
define('ENFORCE_GZIP', true);
define('CONCATENATE_SCRIPTS', true);

// Disable in production
define('WP_DEBUG', false);
define('SAVEQUERIES', false);
define('SCRIPT_DEBUG', false);
The DISABLE_WP_CRON one deserves explanation. WordPress fires its built-in cron on page loads, meaning a random visitor’s request gets delayed while scheduled tasks execute. Replace it with a real system cron:
*/5 * * * * wget -q -O - https://yoursite.com/wp-cron.php?doing_wp_cron >/dev/null 2>&1This runs scheduled tasks every 5 minutes without impacting page load times for visitors.
Two constants to watch out for: SAVEQUERIES stores every SQL query for analysis but has a real performance cost. Never leave it enabled in production. SCRIPT_DEBUG loads unminified versions of all core JavaScript and CSS files. Great for debugging, terrible for site speed.
If you manage wp-config.php changes across environments, WP-CLI makes it safer: wp config set WP_POST_REVISIONS 5 --raw. This avoids syntax errors that can take your site down with no helpful error message.
Core Web Vitals: what actually moves the needle
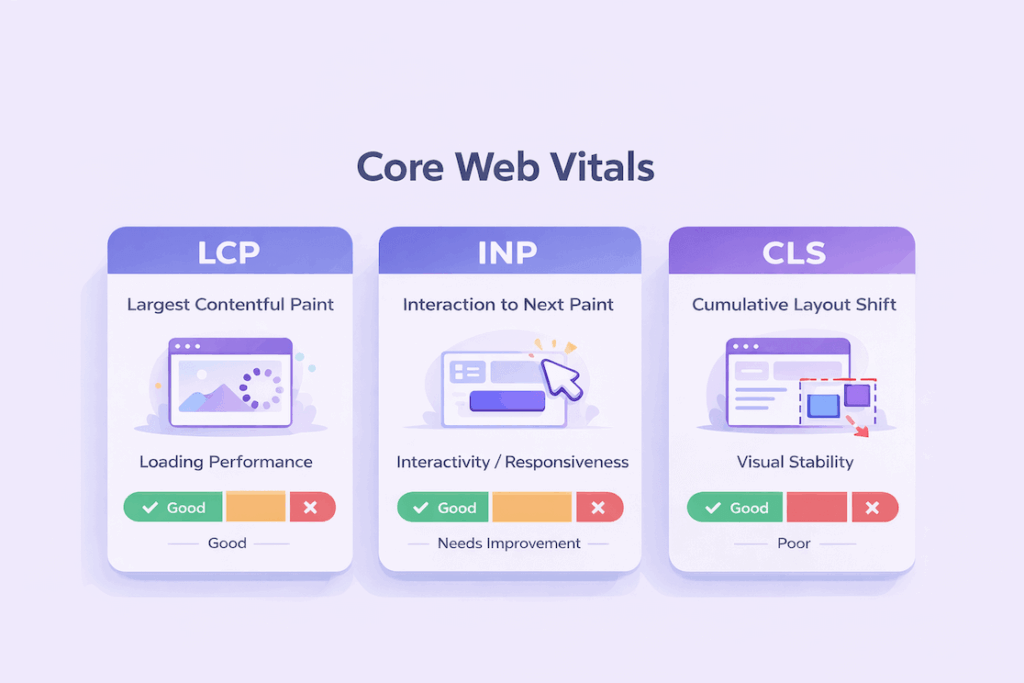
As of early 2026, about 50% of WordPress sites don’t pass all three Core Web Vitals. INP (Interaction to Next Paint) is the hardest to pass, with a 43% failure rate. 90% of failures happen on mobile, not desktop.
Sites that pass all three metrics see 24% lower bounce rates and measurable ranking improvements. Google uses real user field data (CrUX) for rankings, not Lighthouse lab scores, so your own testing in Chrome DevTools isn’t the full picture.
LCP fixes, ranked by impact: Preload your hero image with fetchpriority="high" (saves 200-800ms). Convert images to AVIF or WebP. Inline critical CSS so the browser doesn’t wait for a full stylesheet before rendering. Self-host fonts with font-display: swap.
INP fixes: INP measures the full interaction lifecycle: input delay (main thread busy), processing time (your event handler runs), and presentation delay (browser renders the result). The biggest wins come from deferring third-party scripts that block the main thread, reducing DOM complexity, and using requestAnimationFrame() to batch DOM updates. Server-side GA4 tracking has been documented to reduce blocking scripts by around 400ms.
CLS fixes: Always include explicit width and height attributes on images, videos, and iframes. Reserve space for ads and dynamic content with min-height or aspect-ratio in CSS. Use position: fixed for cookie banners so they overlay content instead of pushing it down.
One thing lab tools can’t measure: INP requires real user interaction. Lighthouse and GTmetrix can’t capture it. You need field data from CrUX, PageSpeed Insights, or the Web Vitals JavaScript library with sendBeacon() to get real INP numbers.
FAQ
Is managed hosting worth the cost for developers?
Usually, yes. The time you spend configuring server-level caching, managing PHP updates, setting up Redis, and tuning Nginx is time you’re not building features. Managed hosts like Kinsta or Cloudways handle all of this and typically deliver sub-200ms TTFB. If your hourly rate is above $30, the hosting cost pays for itself in saved configuration time within the first month.
Does the number of plugins affect performance?
The number itself doesn’t matter as much as what the plugins do. Twenty lightweight plugins can be faster than one poorly coded page builder. The real issue is plugins that load JavaScript and CSS on every page regardless of whether they’re needed, make external API calls on page load, or store large amounts of autoloaded data in wp_options. Use Query Monitor to identify which plugins are actually slow, and use Asset CleanUp to disable plugin assets on pages where they aren’t used.
Should I use a page builder or stick with Gutenberg?
For performance, native Gutenberg blocks win. Page builders like Elementor add significant DOM complexity, extra CSS/JS files, and often inline styles that bypass browser caching. Developers who switched from page builders to Gutenberg have reported 20-40% faster page loads. If you’re comfortable writing code, the block editor with custom blocks gives you full design control without the performance overhead.
How often should I run performance audits?
Monthly at minimum, plus after any significant change (new plugin, theme update, WordPress core update, or content changes). Set up automated monitoring with a tool like DebugBear or SpeedCurve to catch regressions early. For the database specifically, schedule WP-Optimize to run weekly maintenance that cleans expired transients, spam comments, and orphaned data.
Can I get a perfect 100 PageSpeed score on WordPress?
On a simple blog with minimal plugins, yes. On a real production site with analytics, forms, third-party integrations, and dynamic content, a score of 70-80 on mobile is realistic and good enough. Don’t chase a perfect score at the expense of functionality. Focus on passing all three Core Web Vitals thresholds in field data, which is what actually affects your Google rankings.
Summary
WordPress performance optimization works from the inside out. Start at the server: get on modern PHP, use Nginx or LiteSpeed, and enable Redis object caching. Then audit your database, especially that wp_options autoloaded data that silently eats memory on every request. Layer your caching properly (page, object, browser, CDN). Finally, address frontend delivery with image optimization, critical CSS, and deferred JavaScript.
The biggest gains come from the first three layers. Hosting upgrades and database cleanup alone can cut load times in half. Frontend optimizations are important but they’re polishing what should already be a fast foundation.
Measure everything before and after. Query Monitor for server-side profiling, PageSpeed Insights for Core Web Vitals, and CrUX field data for real-world user experience. Numbers don’t lie, and they’ll tell you exactly where to focus next.
If you’re building modern development workflows alongside your WordPress projects, our guide on vibe coding best practices covers the strategies that actually improve your output as a developer. And if you’re using custom post types with complex meta queries, our WordPress custom post types guide covers the registration patterns and REST API setup that keep your content architecture clean from the start. Not sure if your hosting is holding you back? Our shared hosting vs VPS comparison breaks down when it’s time to upgrade.
Recommended reading
If you want to go deeper on why these optimizations work at the protocol level, this is the reference book that covers everything from TCP tuning to HTTP/2 multiplexing.
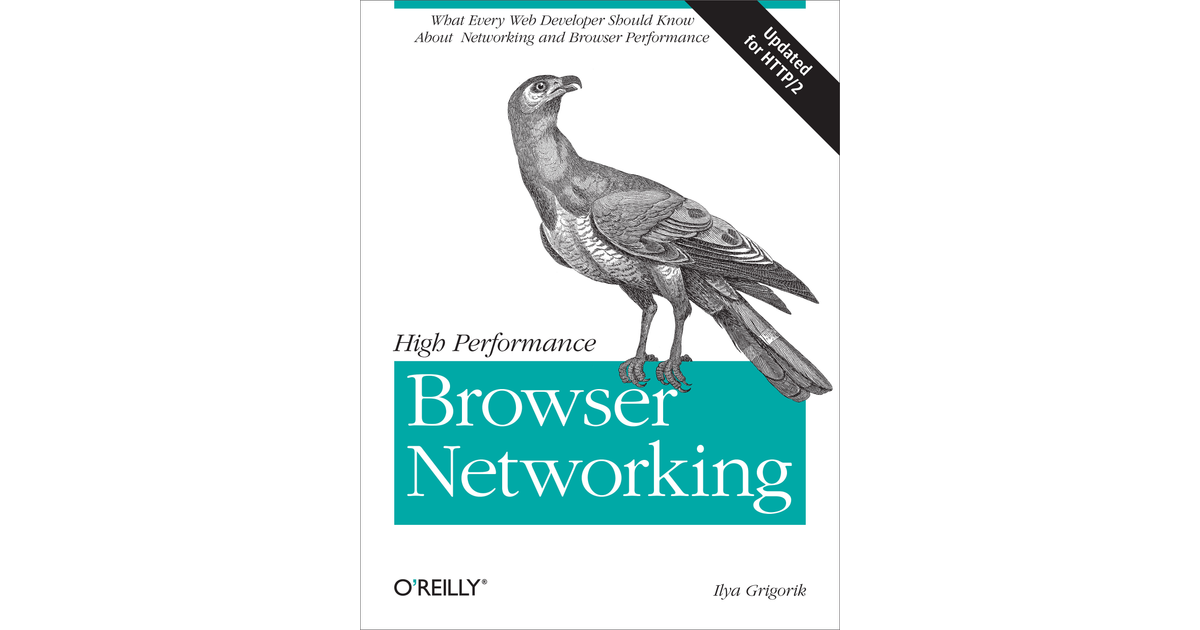
Covers TCP/UDP optimization, HTTP/2, WebSocket, WebRTC, and mobile network performance. The best technical reference for understanding why web performance works the way it does, not just what to change. Written by a Google engineer who helped build Chrome’s networking stack.